 Click pentru a mări |
Description
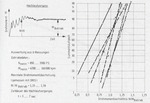
The Figure shows a torque analysis of six different cement mill drives. Although the power range widely (850 .. 3500 hp), was found with start-up process in each case a similar torque curve as it is in the top left image reproduced gualitativ. In the right picture the values as the sum of the frequency ratio of the instantaneous torque for constant torque operation that sets in during the milling process, is applied. It swells were maximum torque .. compared to the operating torque of M / M_Betrieb = 1, 05 1, 58 measured.
|


 Newsletter

 DMG-Lib

 Europeana

 RWTH Aachen
