


|
|
|||||||||||||||
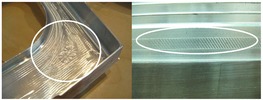
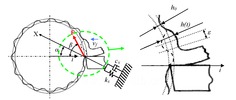
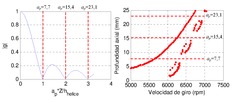
Metodología para la predicción de la estabilidad dinámica en el mecanizado de alta velocidad de suelos delgados |
|||||||||||||||
|---|---|---|---|---|---|---|---|---|---|---|---|---|---|---|---|
|
|
||||||||||||||
| Collections | |||||||||||||||
|
|||||||||||||||
| Images | |||||||||||||||
 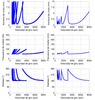      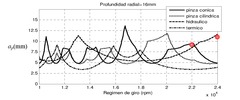      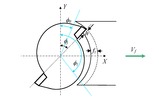      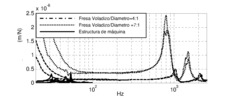    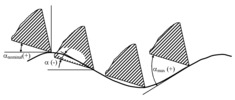                            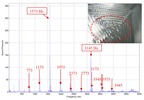                     ![Aproximation of [Altintas, 2001] for circular inserts.](/dmglib/handler?file=images_001/dmg00013677023_/_tn_392x100_dmg00013677023_.png.jpg) 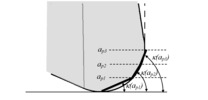   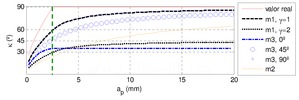        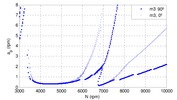                        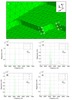            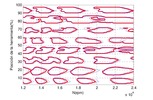      |
|||||||||||||||
| Linked items | |||||||||||||||
|
|||||||||||||||
| Permanent links | |||||||||||||||
|
|
|||||||||||||||
| Data provider | |||||||||||||||
|
|
|||||||||||||||
| Administrative information | |||||||||||||||
|
|||||||||||||||